Some weeks ago we introduced Open Source Development resistance against COVID-19 where we analyzed how a pandemic could impact Open Source development on projects such as the Linux Kernel or Kubernetes. This time, Bitergia runs the analysis on a third project: Hyperledger
Previous analysis catch up
All the different analyses are being done through Cauldron.io, an Open Source SaaS solution for software development analysis developed by Bitergia
In both of the previous analyses we focused on the resistance of Open Source projects development to disruptive changes in their ecosystems. What we want to see now with Hyperledger is slightly different, and that is the main reason why we have been waiting until today to come up with this third analysis: This time, we want to see the resilience of Open Source projects.
Analyzing Hyperledger project
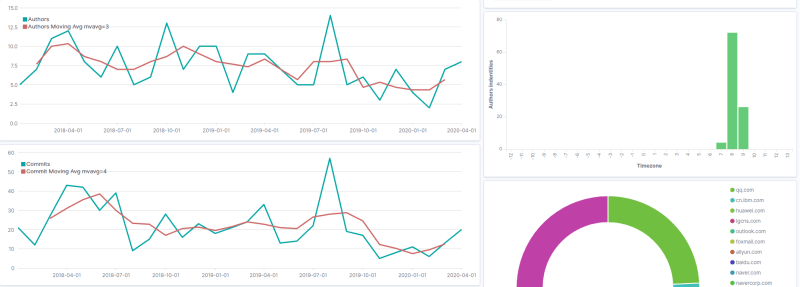
At first glance, Hyperledger authors’s activity has slightly dropped since last week of February:
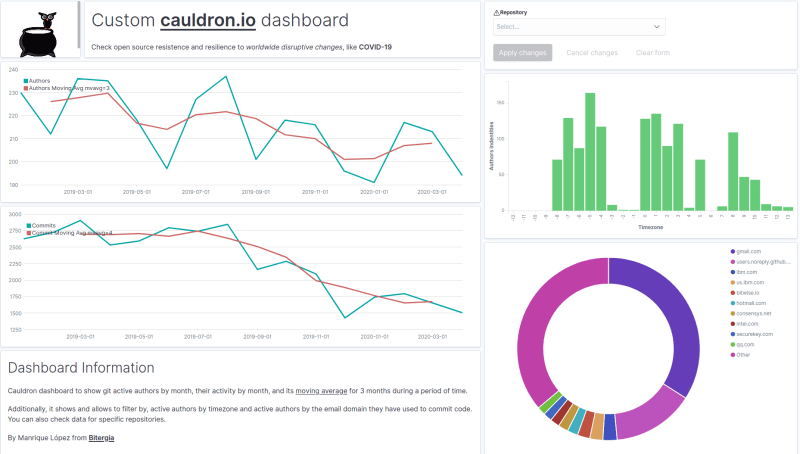
The same as in the Linux kernel and Kubernetes scenario, Christmas holiday valley clearly shows up.
Even though a second drop has been taking place since February 28, when comparing this period with the same period from last year, we find a similar drop at the end of March (we can also see commit activity has been in recession over the past years)
Let’s now focus by timezone to see potential changes on the activity:
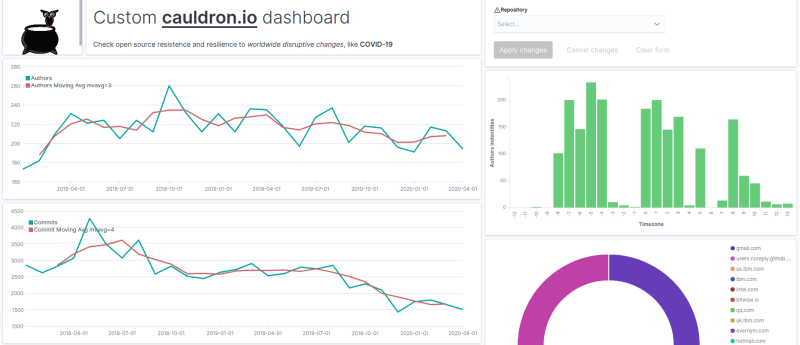
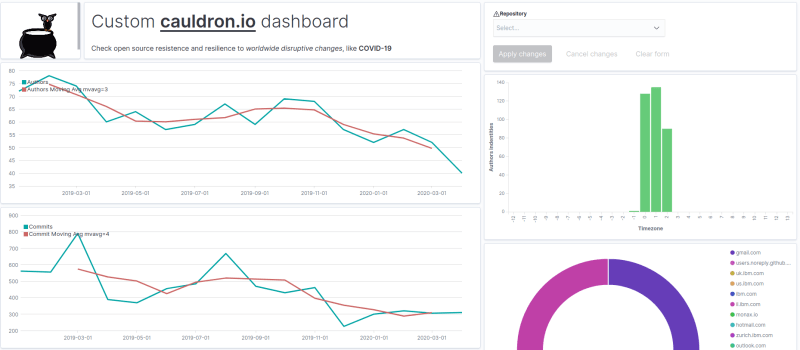
What about Asia?
It’s been a while since COVID-19 affected the Asia area but surprisingly, authors and commit activity increased during last months:
What can happen when we remove the most used non-company’s email domains? The trend remains more or less the same, increasing activity since February and keeping a positive slope.
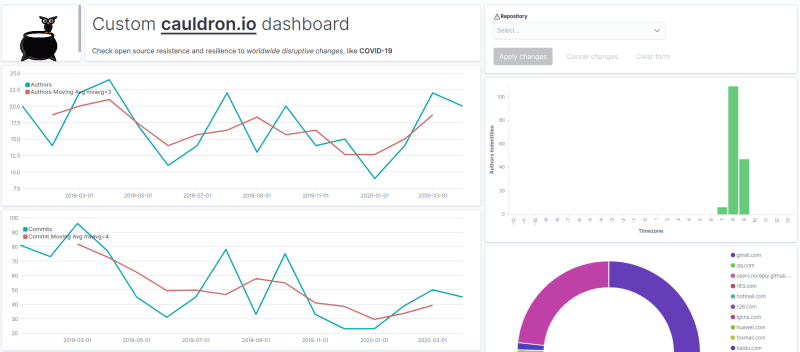
What about Europe and Africa?
When filtering by time zones 0, 1 and 2, here is the dashboard we get:
It looks like right after the Christmas holidays valley, active authors and commit activity have not recovered, and keep having less activity month by month.
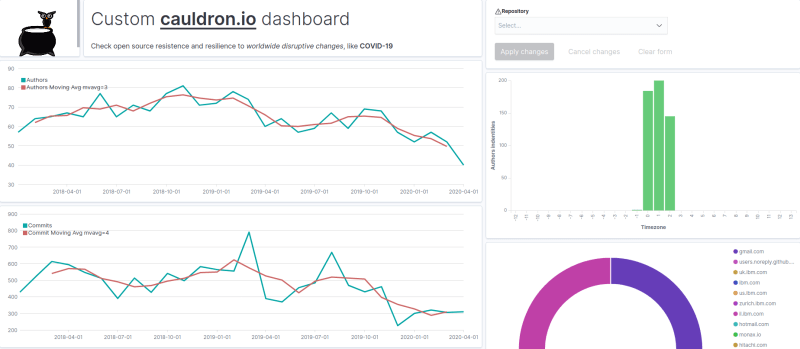
Data from last 2 years, evidence that last year’s drop down in the activity didn’t happened before, and it seems to be unusual for Hyperledger community
What about America?
Covid-19 started to impact American region later than in Asia or Europe. That’s why, in our previous analysis, we couldn’t provide meaningful information in this time zone. Let’s see if we can see what is happening now!
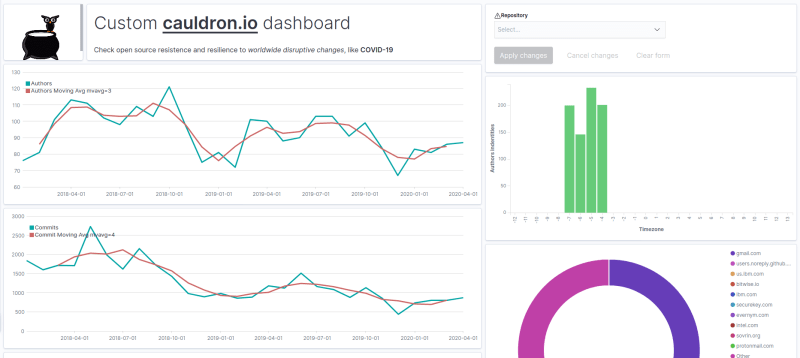
Since October 2018, commit activity is almost the same and active authors are slightly increasing during February and March.
However, when we compare author activity from past 2 year same period (February and March), it’s also remarkable the fact that overall, such activity is decreasing
Bonus point: Filtering Hyperledger activity by project.
This last section is dedicated to all analysts reading this post willing to dig more into the analysis: When using this cauldron.io customized dashboard, you can easily run a similar analysis filtering by project.
For instance, if you are curious about how Fabric, one of the most popular Hyperledger projects, is doing in each of the different areas, and how company domains vs non-company domains are behaving, you can perform this using Cauldron!
Here is a quick gif to show how easy is to navigate through cauldron.io dashboard and get the required information:
note: you can see the user guide and documentation section in cauldron.io community to learn how to export this disruption analysis dashboard in your caudron workspace and how to get started with this open source tool developed by bitergia
Closing Thoughts
When looking at Hyperledger history activity, we can see there is a progressive reduction of authors and commits activity which is not caused by Covid-19 impact. However, the drastic drop during these last months within Europe and Africa timezones, could tell us that Covid-19 countermeasures might have helped to speed up activity drop.
Disclaimer: “Correlation does not imply causation”. We don’t have all the domain knowledge Hyperledger maintainers and community specialists might have. A relationship between COVID-19 and the project’s activity might be just coincidence.
This post is the third of the three analyses we have run (check the previous one about theLinux kernel development and Kubernetes analysis). if you find these studies interesting, feel free to run the same analysis in Cauldron for the projects that matter to you and share your results with comments to this post.
Last but not least! Remember that for further questions and feedback, you can always join Cauldron community