Welcome to the fourth chapter of the Metric of the Month: Leaving Developers. In the last chapter, we talked about Attracted Developers, a metric that helps us to understand the flow of new contributors joining a project or community. In this chapter, we will fully understand the contributors by studying the people leaving the project.
We’re thrilled to keep publishing these metrics series. We enjoy showing you a complete guide for different metrics each month so you can understand more about them. Now, let’s find out more about these developers!
Who are the developers that leave the project?

In the previous blog post, we learned that once you have an identities database to unify all the accounts, it is easy to estimate when a contributor joined a project. But what about knowing when contributors leave a project? They do not often say, ‘bye folks, I’m leaving`, but it would be very helpful for the analysis. All jokes aside, at Bitergia, we have been calculating the number of people leaving a project. When used with the Attracted Contributors metric, this metric will provide you with the information you need to know if a project is growing in contributors.
The Leaving Developers metric defines the number of developers that left the project during the analyzed period. We need this metric to measure the growth of a project in terms of contributors. Still, it is also relevant to help community managers react when someone has been inactive for weeks and could have decided to abandon the project.
Goals of this Metric
When analyzing the health of a project, one of the key indicators is the number of contributors leaving. Even projects with a sustainable trend of newcomers must understand how many people are leaving the project. For example, a project could be appealing to new developers and get many newcomers every month. Still, if the number of developers leaving the project is more extensive, the number of active contributors will decrease. That is a symptom of an unhealthy project.
Implementation
This analysis requires pre-calculation. That means we can only take advantage of some of the possibilities offered by OpenSearch, as only some filters can be used together and get accurate results.The analysis starts by identifying all the unique contributors in the data sets for commits, GitHub issues, and GitHub pull requests. As mentioned in previous blog posts, this is essential for a correct analysis. We maintain an identities database using the GrimoireLab SortingHat tool for that.

Once the process identifies all the unique contributors, we need the data enrichment process to calculate the date with the last contribution for each project member and store it in a dedicated field. The name of that field is `demography_max_date.`
When this data is prepared, we can identify when every community member’s last contribution was made. The next step is to distinguish the active contributors from former contributors. The rule of thumb here is to use a 6-month time window to define when a contributor can be classified as a former contributor. In our experience, this 6-month window has worked for most of our customers. Others, a small minority, went for a shorter period.
The demographics index has all the information we need. To show data for leaving developers, we must filter by the field `data_source:git.` All the records in the index will have the last contribution date for the commit’s author. To create a table with the former contributors, we can create a table following these steps:
- create an enhanced table with the `demographics` index
- use the “Max” aggregation with the field `demography_max_date`
- Create the following term buckets:
- “author_name,” set a size of `100`
- “author_uuid” to have a link to the profile in SortingHat
- “author_org_name” to see the organization for that first contribution
- Add a filter with the field `demography_max_date.` This date must be between `now-20y` and `now-6M`.
There is an interesting modification for this table. We can use the same filter with a different time frame. The idea is to identify the contributors that have been inactive for a while but are not classified yet as former contributors. Create a table like the one above, but add a filter for the field `demography_max_date` when it is between `now-6M` and `now-2M`. The result will be a table with inactive people from 2 to 6 months.
Watch a short video tutorial about the Leaving Developers metric and how to set up this metric on our Platform:
Where can I find this metric?
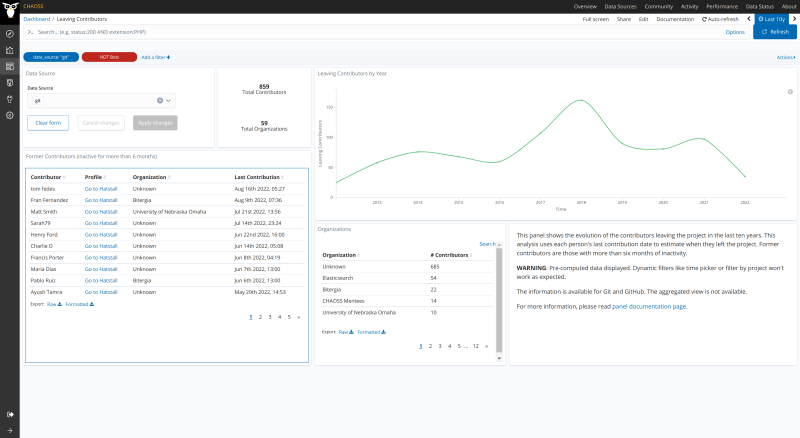
GrimoireLab and Bitergia Analytics provide this metric out of the box. The dashboard Leaving Contributors shows the trend of contributors leaving the project in the last ten years and those recently marked as former contributors. Select the “git” data source in the dropdown selector to show leaving developers.
-
- View an example on the CHAOSS instance of Bitergia Analytics.
-
- Download and import a ready-to-go dashboard containing examples for this metric visualization from the GrimoireLab Sigils panel collection.
Want to know more about Bitergia Analytics Platform?


