During the last months, COVID-19 (i.e., Coronavirus) has grown into a pandemic. Countermeasures to stop spreading the virus are having a huge impact on the economy in many countries. What about the software industry and open source? Would it be possible to check, somehow, the impact the virus has on open source software development? This post shows an initial analysis of how a pandemic can impact open source development.
Background
Last week, some Bitergians were in Pasadena (California) for SCaLE18x. During the conference, the Linux Foundation Members Summit (LFMS) was canceled. We were shocked.
Note: Bitergia would like to give our full support to Angela Brown and the whole LF events team. We are sure this was not an easy decision.
In fact, this kind of announcement wasn’t something new: Many conferences have been canceled all over the world, and this undoubtedly affects open source communities. Because of the LFMS cancellation, Bitergians spent some extra days in Pasadena, and that’s when the idea was born to analyze the impact COVID-19 may have on open source development. We named this analysis “the open source software development resistance“.
What were our initial expectations before the experiment? As open source software development is traditionally related to remote collaboration and since one of the recommendations to stop COVID-19 is to work remotely from home, it shouldn’t be a big challenge for open source maintainers. For this reason, we didn’t expect any big difference in maintainers activity.
Assumptions and Tooling
We wanted to run something simple that anybody could run by themselves, even for their own projects or other projects that matter to them. We found Cauldron to be the most appropriate tool for this analysis.
Among the many different ways to contribute to open source development, we focused on code development, since the majority of the projects use git as a collaboration tool.
With these two points in mind, we decided to run the analysis on 3 big projects, with each representative Asian and European communities. The choice of projects to include in the analysis is based on our knowledge of the large communities these projects have but there was no other objective reason, like a pre-analysis of project size, to select these over other projects. Our analysis is for the following 3 projects:
- Linux kernel activity in https://github.com/torvalds/linux.git
- Kubernetes activity in https://github.com/kubernetes/kubernetes.git
- Hyperledger activity in all the git repositories under Hyperledger organization in Github
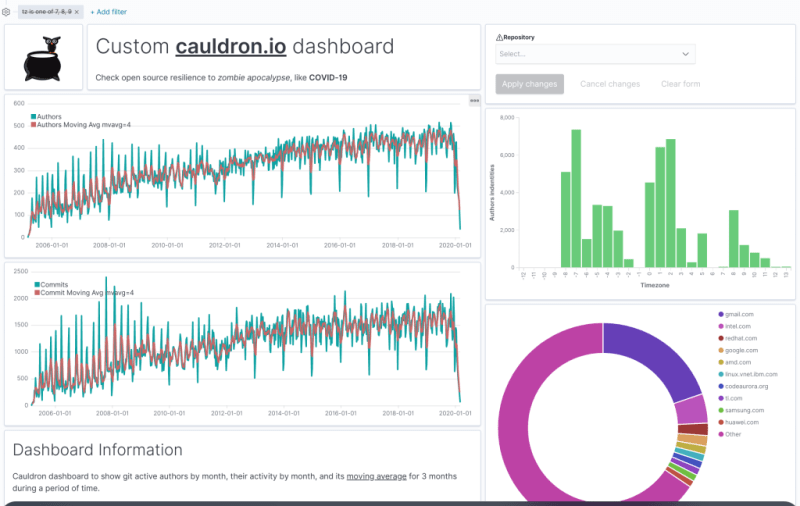
We also build a Cauldron custom dashboard to analyze:
- Active commit authors per week, and the moving average every 4 weeks. We don’t have SortingHat in Cauldron public environment yet, so we would be counting unique identities (the combination
<name email>) used by the authors when pushing code. For big projects, we considered it accurate enough for our quick research.
- The number of commits per week, and the moving average every 4 weeks, to have a detailed view of the last 3 – 4 months. Optionally, we could do it by day, and the moving average for 7 days.

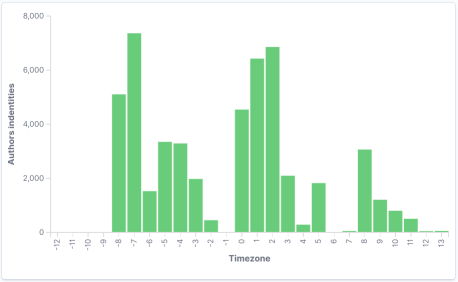
- Active commit authors by time zone, so we easily could filter by Asian or European time zones, for example.
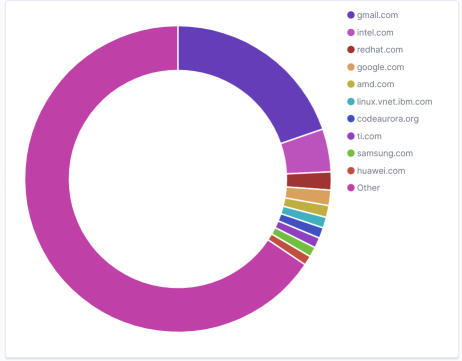
- Active commit authors by the email domain they have used in their email addresses to commit code.
The dashboard is available at one of my custom dashboards for Cauldron. This GitLab repository also documents how to add it to your Cauldron projects to the platform. Feel free to open an issue or to ask in the Cauldron community if you need help.
We have data updated until, at least, March, 6th, 2020.
Analyzing the Linux kernel
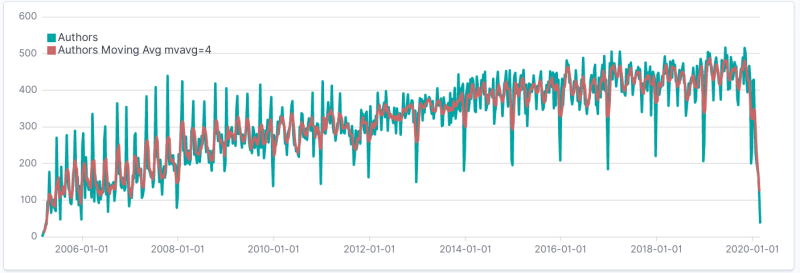
Checking the activity in the Linux kernel during the last months came as the first surprise:

The Christmas holiday season valley is clear, but after a short increase, both active people and contributions fell from hundreds to almost dozens of people. How did it look like the same period one year ago?

The first main difference is that after the recovery from the Christmas holiday season, even given the fall in the last part, the number of active authors never goes below 250 active identities per day.
What about Asia?
Another question we had in mind was if there has been a visible impact in contributions coming from China, or Asia in general. For that, we have used a Kibana filter to check data when the tz parameter is 7, 8 or 9.
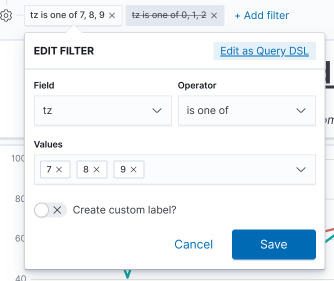
The results are very interesting:
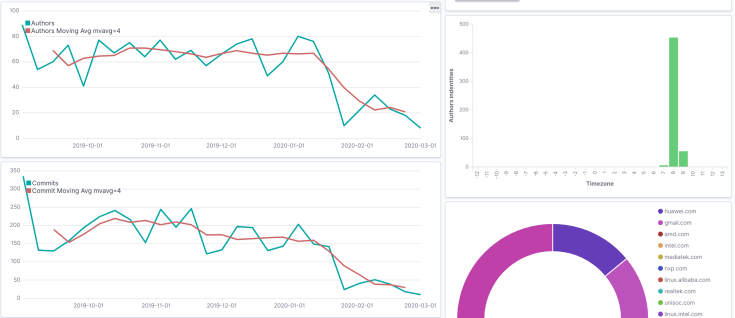
It seems that active maintainers number has drastically reduced since early January 2020. If we compare it with the same period one, one year ago, the difference is obvious.

Interesting, huh?
What about Europe?
Here things look even weirder. It seems the number recovers from Christmas holidays time to quickly fall below the Christmas valley value.

If you compare it with the same period last year:

Very different, right?
What’s next?
In future blog posts, we will release similar outcomes from other projects we analyzed while we were in Pasadena: Kubernetes and Hyperledger.
Another idea in mind is to repeat the analysis on a monthly schedule to check the resilience of these projects and see if there has been a significant reduction and recovery in active people and their associated activity during these COVID-19 months.
Disclaimer: “Correlation does not imply causation”. We don’t have all the domain knowledge Linux kernel maintainers and community specialists might have. A relationship between COVID-19 and the project’s activity might be just coincidence.

And last but not least feel free to run the same analysis in Cauldron for the projects that matter to you and add comments to this post with your results
Kubernetes analysis is already published!!!
Hyperledger analysis is already published!!!