This blog post briefly shows how Bitergia has worked with Open Networking Foundation to build a new dashboard that fits with their metrics strategy and how they were able to turn this information into business insights
You might have all types of data in your hands, but if you don’t know what these data mean, everything would be nonsense. This is something Bitergia has been dealing with over the past years. We learned the importance of building metrics on top of goals, and listen to user needs.
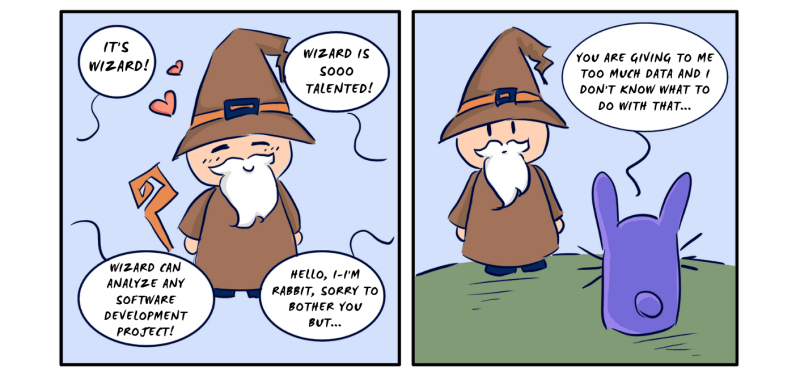
Once upon a time…
A rabbit from Rabbitland visited the Owl’s Nest. They found a wizard who tried to help them to find the metrics they needed. “This book contains all you may need to understand your community”. Rabbit came back to their town and days passed by trying to find in that book the answers to the questions they was tormented by.
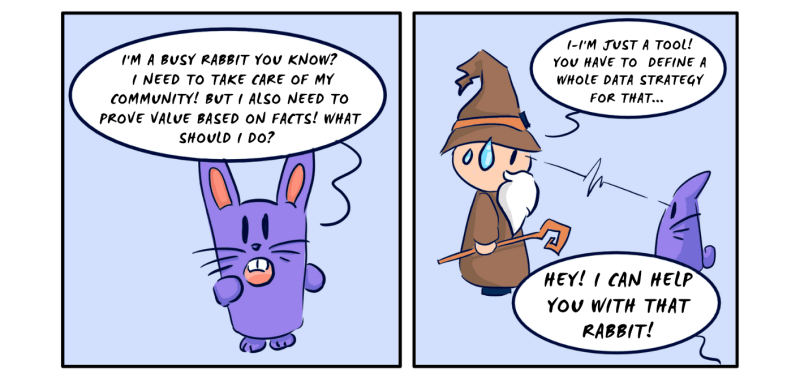
One night, Owl landed on rabbit’s window and asked: “Why are you so upset? Wizard told me they gave you all the recipes you may need”. Rabbit explained to the owl how they became more and more overwhelmed by all the stuff found in the book. “I have a specific need, however, the book contains a lot of recipes we can hardly understand. I’m sure this is really interesting stuff, but I can’t find what we are looking for!”.
“Don’t worry”-said the owl-” The wizard sent me here to help you on your quest”. Rabbit explained what they needed to find:
“In our town” - Rabbit cleared their voice - “there are different tasks a rabbit can do: There are architects, who build our town, there are others that make sure buildings are built correctly. Some rabbits try those buildings, some others visit other towns and talk about rabbit creations. As you can see, you can have a lot of roles in Rabbitlad, but I don’t know who is building things and who is not! plus, it’s impossible to ask one by one.”
“I wish I could identify who in Rabbitland is an architect and who is not! This way, I will make sure to provide to Rabbits the support and tools they deserve!”
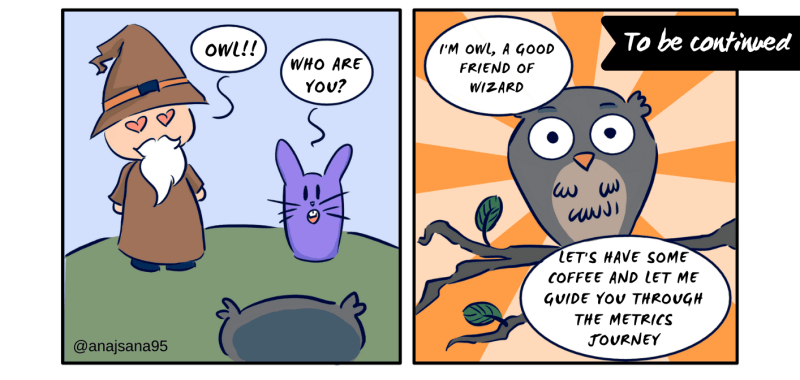
And by the following sunrise, the owl had written a new single recipe that served for Rabbit’s purpose.
Lessons learned
This story is about understanding. Understanding users’ needs is key to provide them what they are looking for or, at least, walk in the right direction. Thus, everything starts by listening to users. Metrics should be built over a goal, to solve one or more questions (goal-question-metric approach sounds familiar around here, doesn’t it?).
One of the latest use cases we had at Bitergia was requested by Open Networking Foundation. They felt overwhelmed by the initial panel we provided.
They explained to us the concepts of hard contributions, which are code contributions, and soft contributions, that are non-code contributions. From this very specific idea and some extra requirements, we started working on the new dashboard. Another key part of the dashboard was being able to filter and compare organizations. They also wanted to have access to Hatstall profiles from the dashboard.
This dashboard focuses on tracking organizations activity through all the available data sources. Different from the Overview dashboard, the activity is split between code contributions and the rest of the contributions. Some examples of metrics available on the dashboard are:
- Organization drop-down list on top allows us to easily filter data by a set of organizations.
![]()
- Contributions big numbers right below offers a quick idea of the volume of activity.
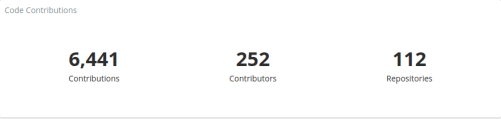
![]()
- Evolution charts provide a more specific view of the activity and when it happened so we can look for peaks or valleys.
- Author tables allow to sorting them by number of contributions and accessing their Hatstall profiles in order to edit their associated data and fix their affiliations if needed.
- Project tables split numbers by project.
- Contributions and Contributors pie charts offer a more visual approach to compare organizations weight on the selected projects (if any)
Closing Remarks
The first step to work on a successful metrics strategy and execution starts with listening skills. The final dashboard was also the result of the final user suggestions. Bitergians are especially proud of this kind of dashboard because we feel they are part of the community (special thanks to Open Networking Foundation who allowed us to share the joint work based on their ideas with the community). You can find more the information available on the issue tracker
When starting a metrics journey, providing metrics is indeed the first move. However, if we want to use software development analytics to drive data among projects, we need to customize those metrics, building a clear goal-question-metrics strategy on top of it.
That is why Bitergia, the company behind GrimoireLab, is there – to help customers establish their personalized metric strategies and provide a customizable metrics platform. Check out bitergia analytics for details