
Metrics to assess risk in open source libraries are becoming more important. We need these tools and techniques to evaluate and mitigate the potential risks associated with using third-party open source software libraries in our own software applications. So, this blog post describes seven important metrics to evaluate this risk from an open source community perspective.
Meet the seven risk metrics
By using these seven risk metrics, software developers and organizations at large can make informed decisions about which open source libraries to use and how to manage the potential risks that may come from these libraries.
The Elephant Factor
The metric Elephant Factor answers the question: What is the distribution of work in the project across organizations?
An Elephant Factor of one (1) indicates the risk that one dominant organization is behind the project. If that organization decides to pull out of that project, a significant amount of knowledge will be lost, and future maintenance will be at risk.
So, a healthy project should have an Elephant Factor of two (2) or above.
The term “Elephant Factor” was coined by Bitergia and presented at OSCON 2015. You can learn more about this metric in the dedicated chapter on our Metric of the Month series: The Elephant Factor.
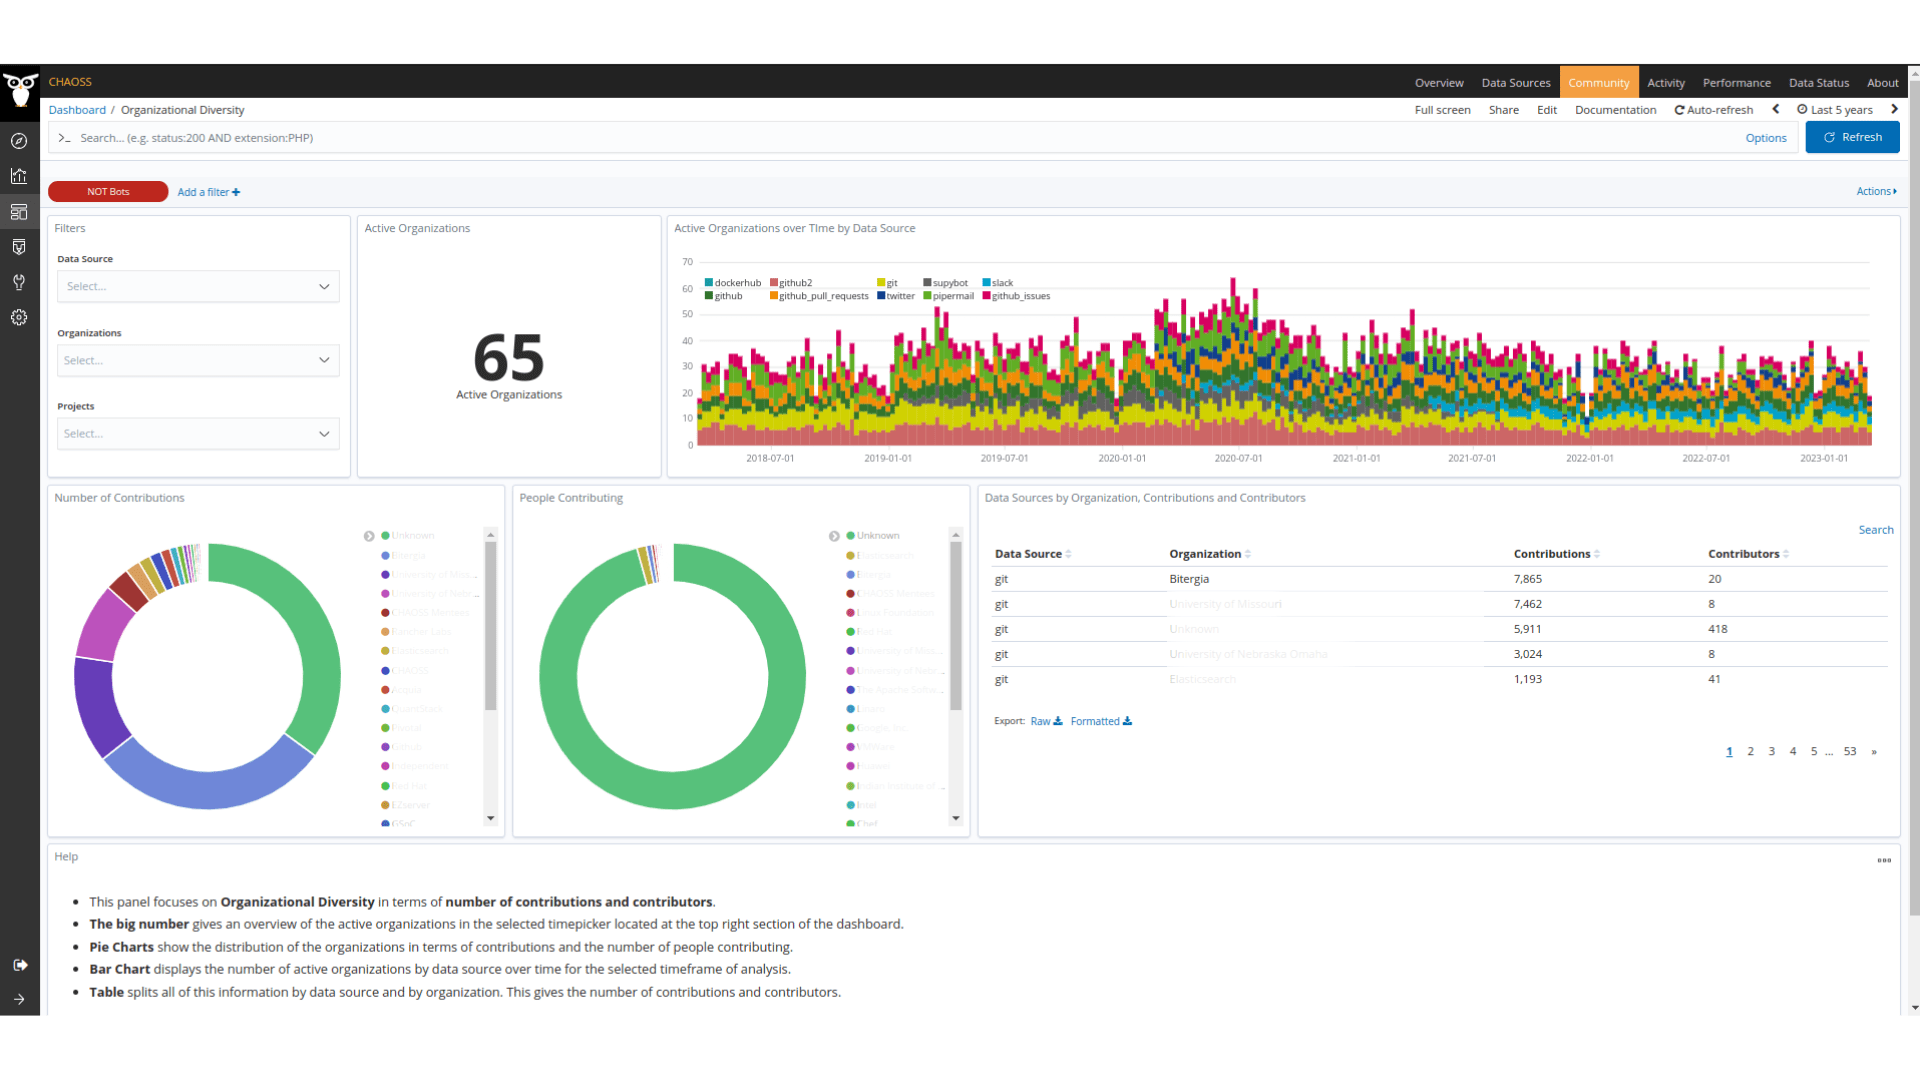
Active Organizations
The metric Active Organizations answers the question: How many organizations actively contribute to the project?
This is similar to the previous metric, Elephant Factor, but informs us how many organizations are active, not just how many had a critical role in the project. This is important because a higher number of Active Organizations means there are more organizations with a vested interest in finding a solution should the health and sustainability of the project be at risk.
A healthy project should have three (3) or more Active Organizations.
The Pony Factor
The metric Pony Factor, also known as the Bus Factor, answers the question: How high is the risk in a project should the most active people leave?
The Pony Factor is the number of critical contributors. This is similar to the first metric, Elephant Factor, but focused on contributors and not organizations. The Pony Factor is calculated based on the contributions to identify the smallest number of contributors that make the most. We assume these active contributors are also the most knowledgeable about the project. When they leave, it would hurt the project and may even endanger its future development.
A healthy project should have a Pony Factor of three (3).
Read the Metric of the Month series: The Pony Factor, to learn more about this metric.
New Contributors
The metric New Contributors answers the question: What is the inflow of new contributors that can sustain the project?
The number of New Contributors counts how many contributors made their first contribution during the analysis period. This metric can help to identify who recently joined so that we can welcome the newcomers and ensure onboarding occurs. To determine the right amount of new contributors, we need to also look at the number of Active Contributors, which is next.
A healthy project should have a steady stream of New Contributors to compensate for the normal and expected attrition of contributors. Assuming a stable number of Active Contributors, both high and low numbers of New Contributors can be a warning sign. A high number of New Contributors could signal that the project is failing to keep contributors despite getting a lot of attention. A low number of New Contributors could signal that a project may not be able to replace leaving contributors.
Find more insights and a completer guide about this metric in the dedicated chapter on our Metric of the Month series: Attracted Developers.
Active Contributors
The metric Active Contributors answers the question: How many contributors are currently active in the project?
The number of Active Contributors increases with New Contributors and decreases with contributors leaving. By looking at the number of Active Contributors over time, we can understand if a community is growing, sustaining, or declining its size.
A healthy project with a growing number of Active Contributors would need to also grow the opportunities for engagement and scale collaboration. If they have a stable number of Active Contributors would need to have a stable inflow of New Contributors. And, a healthy project with a declining number of Active Contributors would need to reduce the scope of work and focus on the essentials.
Backlog Management Index & Review Efficiency Index
The metrics Backlog Management Index (BMI) and Review Efficiency Index (REI) answer the question: How efficient and effective is the open source community in addressing its issues and change requests?
The BMI measures the effectiveness of the community’s backlog management practices. It can indicate systemic problems with the completeness, clarity, and prioritization of items in the backlog. On the other hand, the REI measures the efficiency of a community’s code review practices. The REI can indicate problems with the speed and thoroughness of code reviews, the number of defects found, and the speed of defect resolution. Both metrics are best looked at over time to compare historic levels with current levels. An index value of 1 means that the rate of new issues and code review requests is equal to the issues and code reviews that get completed and closed. An index below 1 means the backlog is growing because there are more new issues or code review requests created than closed. An index value above 1 means that the backlog is shrinking.
So, a healthy project has a stable (0.95-1.15) BMI and REI.
Lead Time for Issues and Code Changes
The metric Lead Time for Issues and Code Changes answers the question: How responsive is the project community?
The metric Lead Time for Issues and Code Changes measures how much time passes from when an issue or code change is submitted until someone replies and it gets closed. A code change is also known as a pull request on GitHub or merge request on GitLab. This metric helps communities identify bottlenecks and inefficiencies in their development process that may be causing delays in resolving issues and merging code changes. Lead Time for Issues and Code Changes is also an indicator for how frustrating it is to contribute because long waits and delays are demotivating.
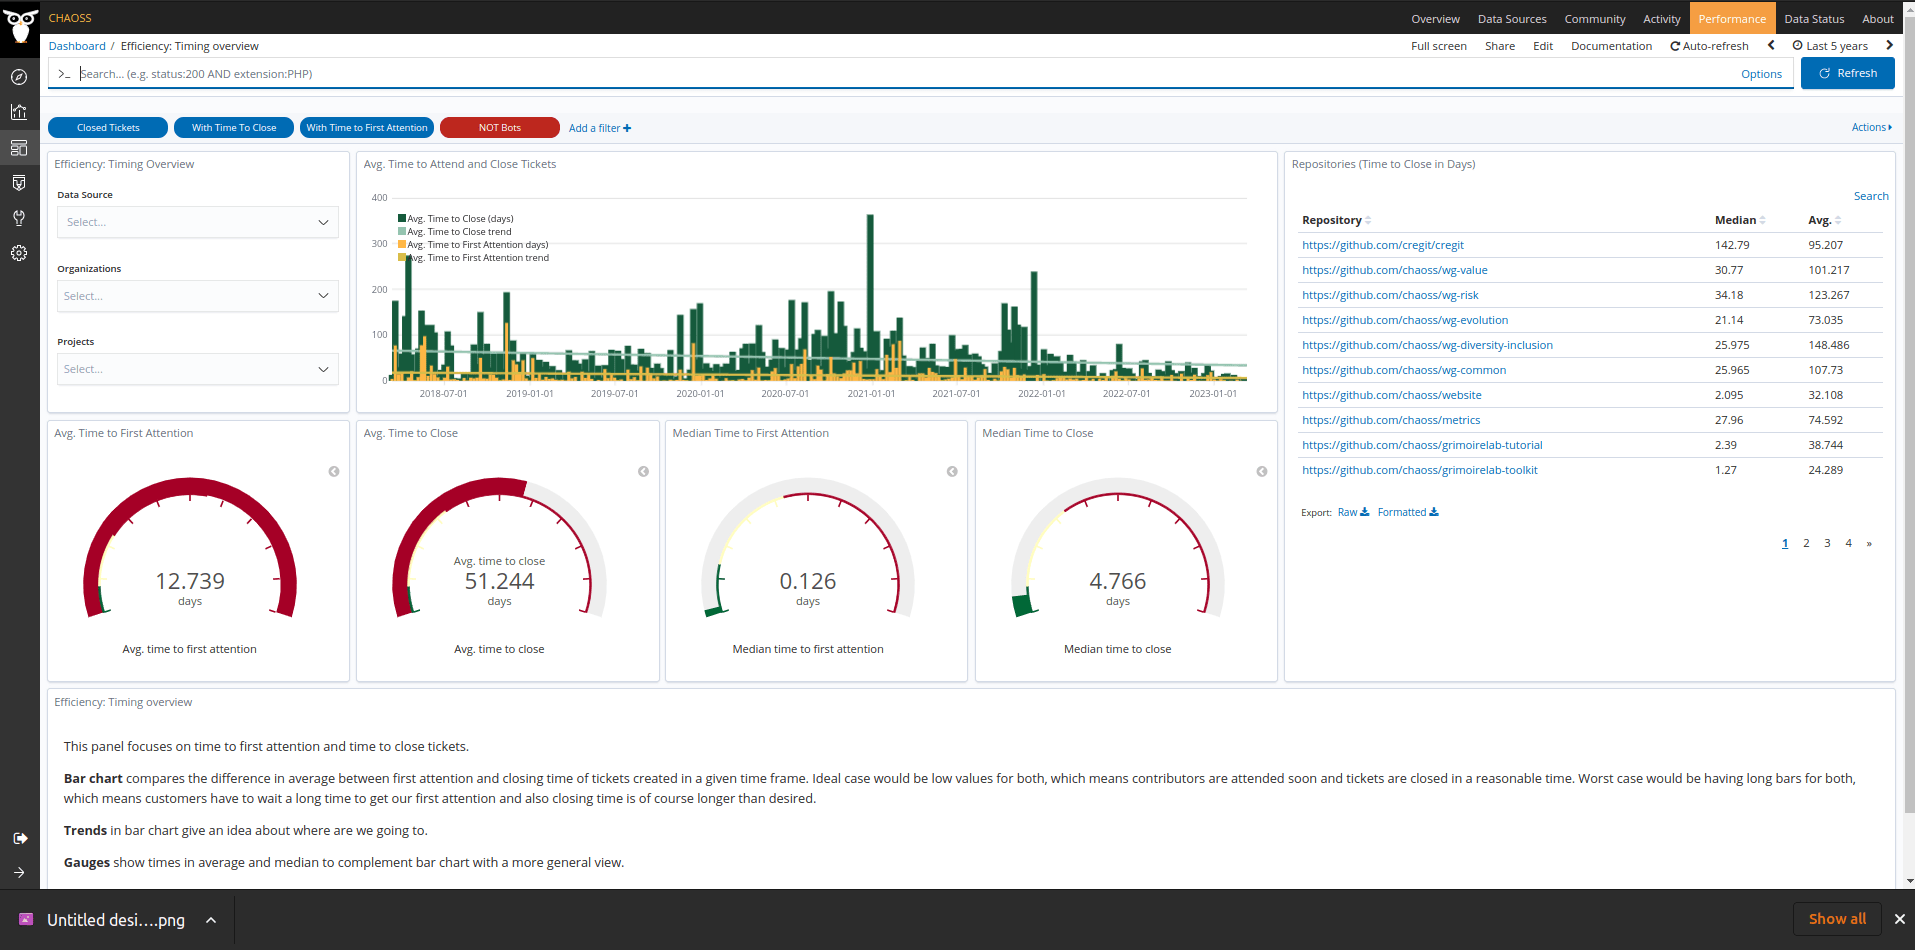
A healthy project has a Median time to first response of less than 2 days and Median time to close of less than 7 days.
How do I track these metrics?
We identified 7 metrics that signal risk in open source projects. We can use these 7 metrics to identify risks and manage them before they become a problem in our software supply chain. Bitergia Analytics Platform supports these 7 risk metrics and offers a centralized source of truth that and saves you hours switching between different platforms to get the data and metrics you need.
So what are you waiting for? Start your metrics journey and keep your risks under control with Bitergia Analytics. Request a free demo of the platform, and we’ll answer any questions you may have!