
Welcome to a new chapter of the Metric of the Month. In this edition, we offer two metrics for the price of one! You will learn about two Efficiency and Effectiveness metrics that Bitergia uses to identify risks in an Open Source project. These metrics are the Backlog Management Index and Review Efficiency Index.
How efficient and effective is a project?
As companies grow and projects become more complex, it becomes increasingly important to have effective backlog management and review processes in place. We can use two key performance indicators to measure the effectiveness of these projects. These are the Backlog Management Index (BMI) and the Review Efficiency Index (REI).
The metrics Backlog Management Index and Review Efficiency Index answer the question: How efficient and effective is a project addressing its issues and change requests?
By calculating these metrics, we obtain indicators about the health of a project. Those indicators can help us identify poorly maintained projects or even those starting to be in a delicate situation recently. This information is key when evaluating the sustainability of the software components your stack depends on. BMI and REI are essential metrics, but to categorize a project, we need more. That is why we presented some weeks ago a list of seven metrics that can help us measure that risk.
Backlog Management Index (BMI)
The Backlog Management Index (BMI) measures the effectiveness of a team’s backlog management process. This metric allows understanding if the team can digest all the issues created or if the number of issues to work on (the backlog) is growing.
To calculate the BMI, you need to use the following formula:
BMI = (closed issues / submitted issues)
As defined by Stephen H. Kan in 2002, the BMI is presented as a percentage. You can find more information about this metric in his book “Metrics and Models in Software Quality Engineering, 2nd Edition, Chapter 4, Section 3.1.”
By analyzing this information over time, it is possible to infer whether a team is being able to absorb all the feedback. At Bitergia, we use this metric to study a project’s trend and how teams manage the backlog with essential components.
In the example below, taken from the CHAOSS community, the red line represents the BMI for each month in the last years. The x-axis represents time, while the y-axis represents a percentage. The threshold (black line) splits the chart into two sections:
- When the line is above the threshold, the team closes more issues than the ones received. That means they are reducing the total backlog. For example, when the value is 150, the team closed 150% of the issues submitted during that period.
- When the BMI is smaller than 100%, the total backlog grows. The team is not being able to digest all the issues. For example, a value of 80 means the team closed 80% of the issues submitted during that period. The rest 20% is still to be closed.
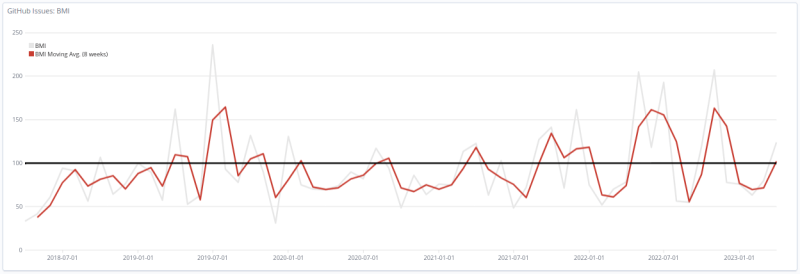
To sum up. A high BMI score means that a team is effectively managing the backlog, while a low score indicates the backlog is growing and the team is probably overwhelmed.
Review Efficiency Index (REI)
This metric is an extension of the BMI but focused on the review activity. It was first coined by Stephano Mafulli in 2015 and adopted by Bitergia. It started to be an essential metric for the OpenStack Community then.
The Review Efficiency Index (REI) measures the effectiveness of a team’s review process. Reviews are an important part of software development because they ensure that work meets the necessary standards and requirements.
To calculate the REI, you need to use the following formula:
REI = (closed reviews / submitted reviews)
As happens with the BMI, it should be presented as a percentage. At Bitergia, we study the total value for a period and its value over time. The main difference with BMI is that the typical list of pull requests to be digested in healthy teams is smaller than the backlog of issues. For example, if we analyze the second version of Angular we see that the amount of issues and reviews submitted in total is pretty similar, while the number of open issues is 10x the number of open code reviews.
In our example taken from the CHAOSS community, we can see that the REI is, most of the time, over 90%, and there are frequent peaks reaching 110%. This tells us that the team can handle the reviews in a timely fashion.
Fun fact, in the image below, there is a significant drop between October 2021 and March 2022. Our folk Santiago Dueñas, who reviews most of the code contributed to GrimoireLab, was on parental leave. It affected significantly not only the REI of GrimioreLab but all the REI of the CHAOSS project.
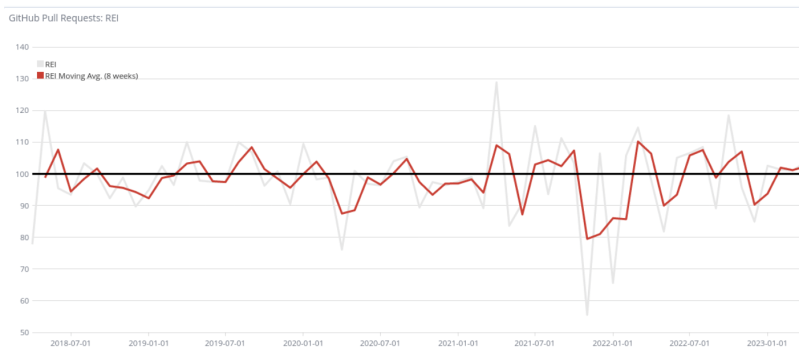
Remember this key takeaway for the REI. It provides information about how efficiently a team reviews code. A high REI score means your team effectively manages the review process. In contrast, a low score indicates that the list of code contributions pending review is longer. This is particularly important because they can get outdated quickly.
Using them together
The Backlog Management Index (BMI) and the Review Efficiency Index (REI) are two key performance indicators used to measure the effectiveness of backlog management and review processes. By analyzing these factors, you can determine whether your team is effectively managing its backlog and review processes and identify areas for improvement. With these KPIs in place, you can ensure that a team is on track to deliver high-quality work on time and within budget.
Where can I find this metric?
GrimoireLab and Bitergia Analytics provide these metrics out of the box. The dashboards GitHub Pull Requests Efficiency and GitHub Issues Efficiency show the Review Efficiency Index and the Backlog Management Index, respectively.
- View an example on the CHAOSS instance of Bitergia Analytics.
- Download and import a ready-to-go dashboard containing examples for this metric visualization from the GrimoireLab Sigils panel collection.
Watch a video explanation about the Backlog Management Index and Review Efficiency Index, visualization examples and goals.