Welcome to a new chapter of the Metric of the Month. This time, we will focus on the Lead Time metric, a measure of performance that we use at Bitergia to identify risks in an Open Source project. Observing how this metric evolves over time can help us to improve our processes by identifying bottlenecks and discovering flaws in our system that can cause delays in solving issues and merging code changes.
How Responsive is the Project Community?
The Lead Time is defined as the time, expressed in days, between initiating and completing a production process. The goal is to minimize the lead time, which helps to improve the team’s efficiency and speed in delivering software.
For Issues, this metric measures the time a software development team takes to resolve and close issues (also referred to as “Time to Issue Resolution” or “Time to Close”). For code changes (such as Pull Requests), it measures the time to complete review processes (also referred to as “Change Requests Duration” or “Time to Merge”) from when they were opened until they were merged, accepted, or closed.
This metric can be calculated using the following formula:
Lead Time = Time when the item was closed – Time when it was opened
Lead Time is also an indicator for detecting a change in community activity. Long waits and delays can indicate potential maintainer burnout. For the contributors, these delays can be demotivating, and they can lead to a reduction in the diversity of contributions.
The Lead Time metric can be complemented with BMI and REI metrics, presented in the blog post with a list of seven metrics that can help us measure risk in an Open Source project.
Time to Close for Issues
Extending what we teased in the previous section, this metric is a specific implementation of the Lead Time metric, focused on issues, reviews, or tickets. As defined by the CHAOSS Project, the time to close is the total amount of time, usually expressed in days, that passes between the creation and closing of an operation, such as an issue, review, or support ticket. The operation must be open and closed, as is often the case in code review processes, question-and-answer forums, and ticketing systems.
This metric can be calculated as follows:
Time to Close (days) = Time when the item was closed – Time when it was opened
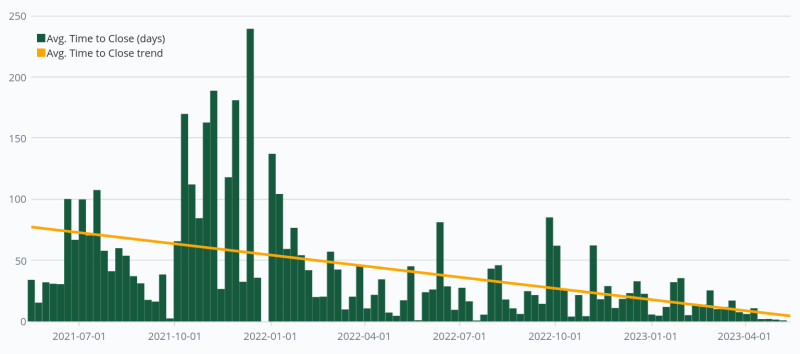
At Bitergia, we use this metric in different ways. One is showing its evolution over time and observing its trend.

We could further represent this metric by the project to understand where these high values took place and learn from it. Also, comparing these values with the median days to close would be helpful. Looking at how close or far those values can give us an idea about the effect of the outliers, usually a few issues which remained open for too long (who does not have at least one issue in their project that has been open for ages?).
Change Requests Duration
This metric is also a specific implementation of the Lead Time metric, this time for Change Requests. The difference with the Time to Close metric is that this one considers the time between the moment the Change Request was sent to the moment it is accepted or merged, considering all the steps in the development process, including coding, testing, reviewing, and merging.
Depending on the platform, these Change Requests can take different names, for instance, “Pull Requests” in the case of GitHub and “Merge Requests” in the case of GitLab. This metric can be calculated as follows:
Change Request Duration (days) = Time when the item was merged, accepted, or closed – Time when the item was opened.
Similar to what we represented for the Time to Close for Issues, we usually represent this metric as “Time to Merge”. In the example below, we are representing here the days to merge GitHub Pull Requests from the CHAOSS community.

To show the value on the image, we use the gauge visualization, which is useful to define the values you consider best fitting to your projects. By default, we are using the following ranges: from 0 to 7 days (first portion, green), from 7 to 30 days (second portion, yellow), and more than 30 days (last portion, red).
The first thing we notice is a big difference between the average values over time and the median value we have on the left. These values hint that at least half of the Pull Requests were merged quickly (within the same day), whilst other Pull Requests took much longer to merge, affecting the overall value.
Where can I find these metrics?
GrimoireLab and Bitergia Analytics provide these metrics out of the box. The dashboards – and – show the – and the –, respectively.
- View an example on the CHAOSS instance of Bitergia Analytics:
- Download and import a ready-to-go dashboard containing examples for this metric visualization from the GrimoireLab Sigils panel collection.
Watch a video explanation about the Time to Close for Issues and Change Requests Duration, visualization examples, and goals.
Did you like this chapter? Give us your opinion in the comments or share it on social media. And every suggestion or idea about a metric you want to know more is welcome, we want to share our knowledge with you!


